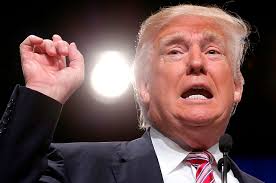
How This Presidency Hurts the Economy and Bets Against Allies
Let’s dispense with the spin. The current administration’s foreign policy isn’t just failing; it is a masterclass in catastrophic recklessness.
While Ukrainian forces were attacking Russian oil refineries in the summer of 2025, gradually draining the Russian economy of fuel, this administration was busy wrecking the American economy in the Persian Gulf. President Trump’s disastrous war with Iran, which began on February 28, not only devastated the country’s economy but also caused diesel prices to skyrocket over $3.81 to a punishing $6.19 per gallon at some gas stations.
It should be noted that, according to EIA data, the war in Ukraine had little impact on American fuel prices, so the culprit for soaring prices should be looked for in the troubles of the Persian Gulf.
At the time of the American attack, Trump’s attack, on Iran, Zelensky noted that the American action threatened to choke off the strait, which explains the increase in fuel prices.
But what does this administration do to sabotage a friendly and democratic state such as Ukraine, which is being squeezed from two sides by Russia’s aggressiveness and America’s incompetence? Deliberately disrupting Starlink data transmission in military Ukrainian bases, SpaceX cuts off part of the lifeblood of Ukraine’s defense. By doing this, Elon Musk has once again shown the world who is really in charge of President Trump: “Who is responsible for Starshield restrictions? The US Army, and therefore the President of the USA.”
It is difficult to understand what else to call this other than fraudulent. Fuel prices in the United States are rising due to the policy of an incompetent president, and at the same time, the administration is deliberately narrowing the possibilities of a friendly country in the war with Russia, deliberately provoking new disasters for itself and the country.
Donald Trump’s Economic Track Record: Promises Unkept, Numbers Disagree
Blue Press Journal – Economic Correspondent February 22 , 2026
The 2024 Campaign Pitch: “More Jobs, Lower Prices, A Smaller Trade Deficit”
When Donald Trump entered the 2024 presidential race he leaned heavily on a familiar economic narrative: “We’ll bring back American jobs, crush inflation, and slash the trade deficit.” The former president’s campaign literature, televised ads, and rally speeches repeatedly promised a resurgence of manufacturing, a pocket‑friendly cost‑of‑living, and a decisive renegotiation of U.S. trade balances.
Fast forward to the first half of 2026, and the data tell a starkly different story.
1. Manufacturing Jobs: A Net Loss, Not a Gain
Year‑Half
Manufacturing employment change*
2024 H2
–34,000
2025 H1
–58,000
2025 H2
–42,000
2026 H1*
–61,000
*Source: U.S. Bureau of Labor Statistics (BLS), “Employment Situation – Manufacturing”
The BLS data reveal that U.S. manufacturing employment fell by roughly 195,000 jobs between the second half of 2024 and the first half of 2026—the sharpest decline in any 12‑month period since the post‑2008 recession rebound.
Trump’s 2024 platform cited the “historic tax cuts and deregulation” of his previous administration as the engine for job growth. Yet the new wave of tariff‑induced supply‑chain disruptions, combined with a lack of substantive investment incentives, appears to havestifled the sector he vowed to revive.
Why it matters: Manufacturing jobs traditionally pay above‑average wages and are a key proxy for the health of the industrial base. Their erosion undercuts the “America‑first” narrative that has become a cornerstone of Trump’s political identity.
2. Consumer Prices: Inflation Moves in the Wrong Direction
Quarter
Consumer Price Index (CPI) YoY Change
Q4 2023
3.2 %
Q2 2024
4.1 %
Q2 2025
5.0 %
Q2 2026
5.8 %
*Source: U.S. Bureau of Economic Analysis (BEA), “Personal Consumption Expenditures Price Index”; Federal Reserve Economic Data (FRED).
While the administration repeatedly boasted that “prices are finally falling,” the CPI has accelerated to a 5.8 % year‑over‑year increase in the most recent quarter, the highest level since 2008. The uptick is driven largely by energy, food, and core goods—categories where policy levers such as tariffs and deregulation have had limited mitigating impact.
Compounding the picture, real Gross National Product (GNP) per capita slipped from $61,200 in 2023 to $60,400 in 2025, a 1.3 % contraction (BEA, “National Income and Product Accounts”). A declining GNP alongside rising consumer prices is a textbook sign of eroding purchasing power.
Why it matters: The promise to “reduce prices” was a direct appeal to middle‑class voters fatigued by post‑pandemic inflation. The data suggest the opposite—a real‑terms squeeze on household budgets that the administration has yet to address in substantive policy terms.
3. Trade Deficit: The Gap Remains Wide
Year
U.S. Trade Deficit (Billion USD)
2022
$889 B
2023
$915 B
2024
$941 B
2025
$960 B
2026 H1
$489 B (annualized)
*Source: U.S. Census Bureau, “Foreign Trade”; Office of the United States Trade Representative (USTR).
Trump’s campaign pledged to “drastically shrink the trade deficit” through renegotiated agreements and tougher tariffs. The numbers, however, show a steady widening of the deficit, climbing from $889 billion in 2022 to an annualized $960 billion in 2025. Even after the 2024‑2025 tariff hikes on steel and aluminum, imports continued to outpace export growth, and the trade balance in the first half of 2026 remains well above the target set by the campaign (a 20 % reduction from 2022 levels).
Why it matters: A persistent trade deficit can signal structural competitiveness issues, and it undermines the administration’s narrative of “America‑first” economic sovereignty. The failure to achieve measurable reduction raises questions about the efficacy of the protectionist tools employed.
4. The Political Calculus Behind the Numbers
Trump’s rhetoric remains unchanged: “We’re bringing back jobs, making goods cheaper, and protecting American workers.” Yet the empirical record tells a story of policy misfires, insufficient investment incentives, and a reliance on short‑term protectionism that has not translated into the promised macro‑economic outcomes.
Critics argue that the administration’s focus on tariff‑driven “win‑now” tactics has diverted attention from longer‑term drivers of manufacturing growth—such as workforce development, R&D tax credits, and infrastructure spending. Moreover, the lack of coordinated monetary‑fiscal policy to curb inflation has left households bearing the brunt of rising prices.
For voters who still see Trump as the only viable alternative to the Democratic establishment, the data present a cognitive dissonance: a nostalgic promise set against a reality of job loss, higher costs, and a swelling trade gap.
5. Bottom Line: Promises vs. Performance
Promise
2024 Campaign Claim
2026 Actual Outcome
Manufacturing jobs
“Millions of new jobs”
~195,000 net loss (2024‑2026)
Consumer prices
“Prices are falling”
5.8 % YoY CPI increase (Q2 2026)
Trade deficit
“Cut by half”
Deficit grew 8 % (2022‑2025)
The disconnect is stark. While political messaging continues to echo the slogans that once propelled Trump to the White House, the objective economic indicators point to a performance that falls far short of the campaign’s own benchmarks.
If the 2026 electorate wants a leader who can turn rhetoric into measurable prosperity, the data suggest a re‑evaluation of Trump’s economic track record is overdue.
All figures are drawn from publicly available government sources, including the Bureau of Labor Statistics, the Bureau of Economic Analysis, the U.S. Census Bureau, and the Office of the United States Trade Representative.